Some of you may have heard me ranting on Packet Pushers on stupid network tricks and why we continue to be forced to implement kluges as a result. I made some comment about trying to come up with some metric to help measure the deviation of the network from the “golden” desired state to the dirty, dirty thing that it’s become over time due to kluges and just general lack of network hygiene.
So I decided that I would write a bit of code to get the conversation started. All code discussed is available on my github here
The Idea
What I wanted here was to create some pseudo-mathematical way of generating a measurement that can communicate to the management structure WHY the requested change is a really, really, bad idea.
Imagine these two conversations:

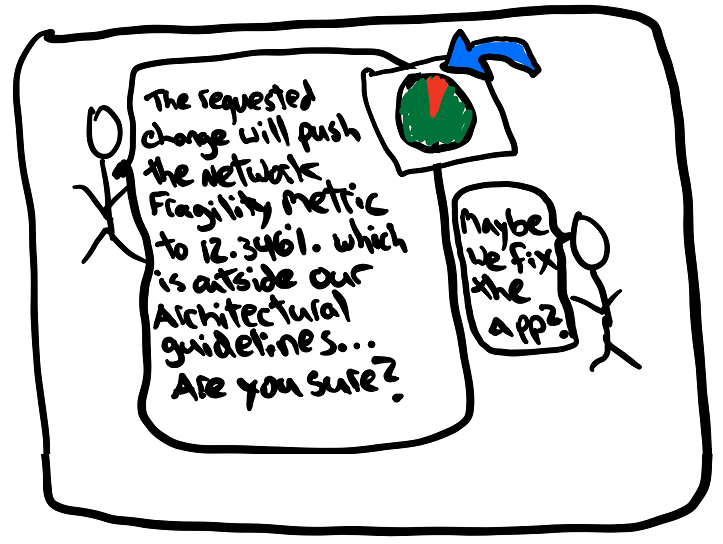
Which conversation would you like to be part of?
Assumptions:
I’m making some assumptions here that I think it’s important to talk about.
- You have a source-of-truth defined for your network state. That is you have abstracted your network state into some YAML files or something like that.
- You have golden configurations defined in templates (ex Jinja2 ). These templates can be combined with your source-of-truth and used to generate your “golden” config for any network device at any time.
- You have “current-state” templates (jinja2) defined that include all your kluges that can be combined with your source-of-truth and used to generate your “golden” config for any network device at any time.
The Fragility Metric
So how does one calculate the fragility of a network?
Wow! Thanks for asking!
My methodology is something like this.
- Generate the configurations for all network devices using the golden configuration templates.
- Generate the configurations for all network devices using the “current-state” configuration templates.
We should now be left with a directory full of pairs of configs.
We then use the python difflib SequenceMatcher library to calculate the difference between the pairs of files. The difflib library allows us to take two text files, eliminate the white space and compare the contents of the two files. One of the cool things is that it can give us a ratio metric which gives us a number between zero and one to measure how close the two files are.
What this means is that you can get this as output.
5930-1.cfg stability metric: 1.0
5930-2.cfg stability metric: 0.9958677685950413
7904-1.cfg stability metric: 0.9428861101723556
7904-2.cfg stability metric: 0.9405405405405406
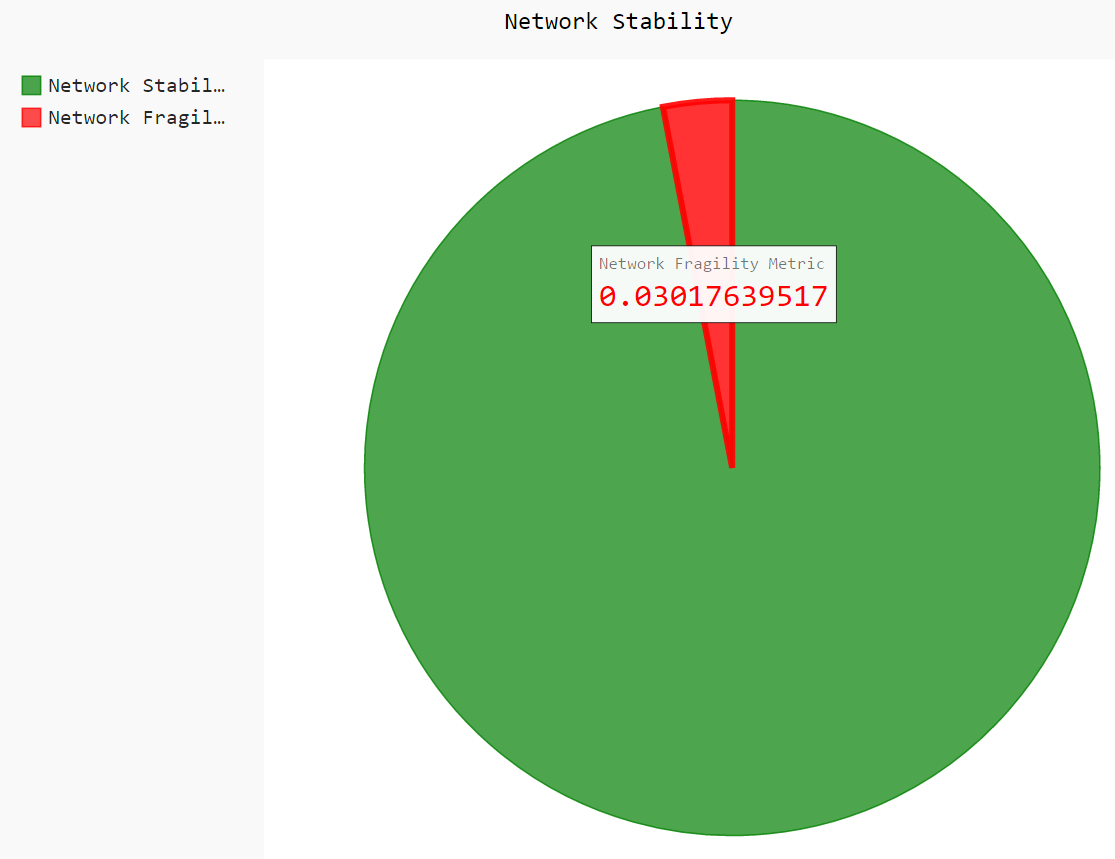
Now that we’ve got a ratio for how different all of the pairs of files are, we can then calculate the mean average of all the files to calculate the network stability metric and network fragility metric
Network Stability Metric: 0.9698236048269844
Network Fragility Metric: 0.030176395173015624
HINT: If you add the two numbers together…
You can also get a nice graph
Note: The pygal library produces a much cooler graphic which you can see here
The Approach
So the first thing I want to make clear is that I don’t intend this to REALLY measure the risk of a given configuration.
One idea I did have was to adjust the weighting of a specific configuration based on the role of that device.
Example – The core switch blowing up is PROBABLY a lot worse than an edge switch tanking because of some kludgey configuration.
This would be fairly easy to implement by placing some meta data on the configs to add their role.
It would be fairly easy to go down rat holes here on trying to identify every single line that’s changed and try to weight individual changes
Example – Look for [‘BGP’,’OSPF’,’ISIS’,’EIGRP’] in the dirty config and then weight those lines higher. Look for [‘RIP’] and rate that even higher.
Cause.. C’Mon… Friend don’t let friends run RIP, right?
Again, all the code is available here. Have a look. Think about it. Give me your feedback, I’d love to know if this is something you see value in.
