One of the most useful and least updated pieces of network documentation is the network diagram. We all know this, and yet we still don’t have/make time to update this until something catastrophic happens and then we says to ourselves
Wow. I wish I had updated this sooner…
Graphviz
According to the website
Graphviz is open source graph visualization software. Graph visualization is a way of representing structural information as diagrams of abstract graphs and networks. It has important applications in networking, bioinformatics, software engineering, database and web design, machine learning, and in visual interfaces for other technical domains.
note: Lots of great examples and docs there BTW. Definitely check it out.
Getting started
So you’re going to have to first install graphviz from their website. Go ahead… I’l wait here.
Install the graphviz python binding
This should be easy assuming you’ve already got python and pip installed. I’m assuming that you do.
>>> pip install graphviz
Getting LLDP Neighbors from Arista Devices
You can use the Arista pyeapi library, also installable through pip as well. There’s a blog which introduces you to the basics here which you can check out. Essentially I followed that blog and then substituted the “show lldp neighbors” command to get the output I was looking for.
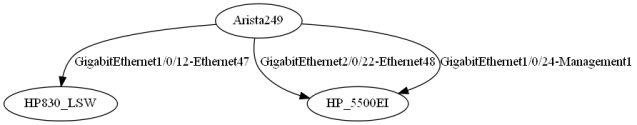
Creating a Simple Network Diagram
The code for this is available here
Essentially, I’m just parsing the JSON output from the Arista eAPI and creating a DOTfile which is used to generate the diagram.
Pros: It’s automated
Cons: It’s not very pretty at all.
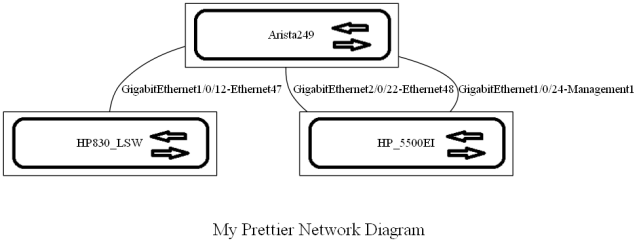
Prettying it up a Bit
Code for this is available here
So with a little bit of work using the .attr methods we can pretty this up a bit. For example the
dot.attr('node', shape='box')
method turns the node shape from an ellipse into a box shape. The other transformations are pretty obvious as well.
Notice that we changed the shape of the shape, the style of the arrows a bit and also shaded in the box. There are a lots of other modifications we can make, but I’ll leave you to check out the docs for that.

Adding your own graphics
Code for this is available here
Getting a bit closer to what I want, but still I think we can do a bit better. For this example, I used mspaint to create a simple PNG file with a switch-ish image on it. From what I can tell, there’s no reason you couldn’t just use the vendor icons for whatever devices you’re using, but for now, just playing with something quick and dirty.
Once the file is created and placed somewhere in the path, you can use this method
dot.attr('node', image="./images/switch1.png")
to get the right image. You’ll also notice I used
dot.attr('edge', arrowhead='none')
to remove the arrow heads. ( I actually removed another command, can you spot it? )
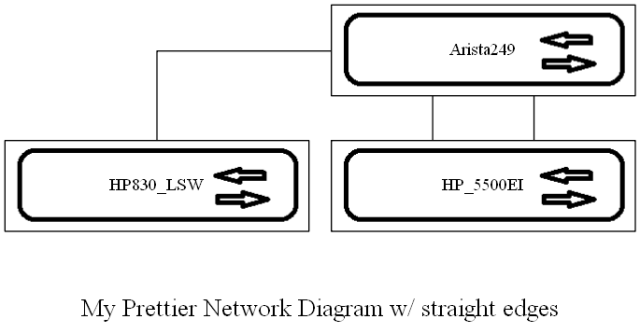
Straighter Lines
Code for this is available here
So looking at this image, one thing I don’t like is the curved lines. This is where Graphviz beat me for the day. I did find that I was able to apply the
dot.graph_attr['splines'] = "ortho"
attribute to the dot object to get me the straight lines I wanted, but when I did that, I got a great message that told me that I would need to use xlables instead of standard labels.
Next Steps
Code for this is available here
For this next step, it was time to get the info live from the device, and also to attempt to stitch multiple devices together into a single topology. Some things I noticed is that the name of the node MUST match the hostname of the device, otherwise you end up with multiple nodes. You can see there’s still a lot of work to do to clean this up, but I think it’s worth sharing. Hopefully you do too.

Thoughts
Pros: Graphviz is definitely cool. I can see a lot of time spent in drawing network diagrams here. The fact that you could automatically run this every X period to ensure you have a up to date network diagram at all times is pretty awesome. It’s customizable which is nice, and multi-vendor would be pretty easy to implement. Worse case scenario, you could just poll the LLDP MIB with SNMP and dump the data into the appropriate bucket. Not elegant, but definitely functional.
Cons: The link labels are a pain. In the short time I was playing with it, I wasn’t able to google or documentation my way into what I want, which is a label on each end of the link which would tell me what interface on which device. Not the glob of data in the middle that makes me wonder which end is which.
The other thing I don’t like is the curvy lines. I want straight lines. Whether that’s an issue with the graphviz python library that I’m using or it’s actually a problem with the whole graphviz framework isn’t clear to me yet. Considering the time saved, I could probably live with this as is, but I’d also like to do better.
If anyone has figured out how to get past these minor issues, please drop me a line! @netmanchris on twitter or comment on the blog.
As always, comments and fixes are always appreciated!

Thanks for your post about graphviz. Have you taken a look at nwdiag? It seems like a decent way to go, but I’m trying to look around at other possibilities as well. That’s how I stumbled on your post.
http://blockdiag.com/en/nwdiag/nwdiag-examples.html
Hi!
I figured out how to add labels to link:
This file contains hidden or bidirectional Unicode text that may be interpreted or compiled differently than what appears below. To review, open the file in an editor that reveals hidden Unicode characters.
Learn more about bidirectional Unicode characters
draw_topology_graphviz.py
hosted with ❤ by GitHub
Graphviz has orthogonal routing though it was a relatively late addition and may need some more work. Stephen North